
Caution
Non-ionizing radiation symbol

Liquid water absorbs microwave radiation strongly enough to enable cooking.
![]() Dielectric constant and polarization
Dielectric constant and polarization
![]() Complex dielectric permittivity
Complex dielectric permittivity
![]() Dielectric spectroscopy
Dielectric spectroscopy
![]() Water
and microwaves
Water
and microwaves
![]() Dielectric loss
Dielectric loss
![]() Effect of salt
Effect of salt
![]() Electromagnetic penetration
Electromagnetic penetration
'The radiation left over from the Big Bang is the same as that in your microwave oven but very much less powerful.'
Stephen Hawking
Unlike conventional ovens, microwave ovens do not rely on temperature gradients (outside to inside) for heat transfer but involve penetrative and instantaneous heating. The microwave oven is part of modern life, but how do the microwaves interact with water in food to efficiently heat the food? Non-equilibrium molecular dynamics simulations have been used to investigate the hydrogen-bond dynamics in bulk water upon microwave heating [3898]. The water dipolea attempts to continuously reorient in electromagnetic radiation's oscillating electric field (see external applet). Dependent on the frequency, the dipole may move in time to the field, lag behind it or remain apparently unaffected. When the dipole lags behind the field, interactions between the dipole and the field lead to an energy loss by heating, which depends on the phase difference of these fields; heating is maximal twice each cycle [455]. d The ease of the movement depends on the viscosity and the mobility of the electron clouds. In water, these rely on the strength and extent of the hydrogen-bonded network. In free liquid water, this movement occurs at GHz frequencies (microwaves), whereas in more restricted 'bound' water it occurs at MHz frequencies (short radio waves) and in ice at kHz frequencies (long radio waves). The re-orientation process may be modeled using a 'wait-and-switch' process where the water molecule has to wait for a while until a favorable orientation of neighboring molecules occurs, and then the hydrogen bonds switch to the new molecule [343]. Microwave heating has been modeled using the TIP4P-FQ potential [570] and is due to the interaction of these moving dipoles. Although molecular vibrations of biomolecules may have microwave frequencies, it is not thought that such resonant coupling is significant due to their low energy compared with thermal energy and the strongly dampening aqueous environment [1331].
The applied field potential (E, volts) of electromagnetic radiation is given by;
E = Emax.cos(ωt)
where Emax is the amplitude of the potential, ω is the angular frequency in radians.second−1, and t is the time (seconds). If the polarization lags behind the field by the phase (δ, radians) then the polarization (P, coulombs) varies as
Lagging cosine wave of the resultant polarisation

P = Pmax.cos(ωt - δ)
where Pmax is the maximum value of the polarization.
Hence the current (I, amperes) varies as
I = (dP/dt) = -ωPmax.sin(ωt - δ)
The power (P, watts) given out as heat is the average value of (current ˣ potential). This is zero if there is no lag (that is, if δ = 0), otherwise
P = 0.5 PmaxEmaxω.sin(δ)
[Back to Top ![]() ]
]
It is convenient to express the relative permittivity (dielectric constant) in terms of a complex number (εr*, complex dielectric permittivity) defined as:
εr* = εr´ - iLf
Where εr´ is the
material's ability to be polarized by the external electric field, Lf (the loss factor, sometimes given as ε") quantifies the efficiency
with which the electromagnetic energy is converted to heat and i
= ![]() . This equation may be visualized
by considering the total current as the vector sum of the charging
current and the loss current; the angle δ as the phase difference (lag) between the electric field and the
resultant (orientation) polarization of the material (see similar
treatment in rheology).
. This equation may be visualized
by considering the total current as the vector sum of the charging
current and the loss current; the angle δ as the phase difference (lag) between the electric field and the
resultant (orientation) polarization of the material (see similar
treatment in rheology).
Tan(δ) = loss current/charging current
 = loss current/charging current")
tan(δ) = loss current/charging current = Lf/εr´
(see derivation)
The terms (εr*, εr´, Lf ) are all affected by the frequency of radiation; the relative permittivity (εr´, dielectric constant) at low frequencies (εS, static region c) and at high ( visible) frequencies the (ε∞, optical permittivity) are the limiting values. The relative permittivity changes with the wavelength (and hence frequency):
![]()
where εS is the relative permittivity at low frequencies (static region), and λS is the critical wavelength (maximum dielectric loss).
![]() (see more on complex dielectric permittivity)
(see more on complex dielectric permittivity)
where τ is the relaxation time (a measure of the time required for
water to rotate (![]() where
r is the molecular radius, k is the Boltzmann constant, and η is the viscosity), also considered
as the delay for the particles to respond to the field change,
or for reversion after disorientation. The maximum loss occurs
when ω = 1/τ b. For water at 25 °C, τ is
8.27 ps (for hexagonal ice at 0 °C, τ ≈ 20 µs) and r is half the (diffraction-determined) inter-oxygen
distance (1.4 Å).
where
r is the molecular radius, k is the Boltzmann constant, and η is the viscosity), also considered
as the delay for the particles to respond to the field change,
or for reversion after disorientation. The maximum loss occurs
when ω = 1/τ b. For water at 25 °C, τ is
8.27 ps (for hexagonal ice at 0 °C, τ ≈ 20 µs) and r is half the (diffraction-determined) inter-oxygen
distance (1.4 Å).
Shows the dimensionless dielectric and dielectric loss reducing with temperature
at the microwave oven frequency 2.45 GHz

Figure 1. Dielectric permittivity and dielectric loss of water between 0 °C and 100 °C, the arrows showing the effect of increasing temperature or increasing water activity.. Data is indicative only but based on [64, 135]; exact data is plotted below and has been reviewed [3089]. The wavelength range 0.01 - 100 cm is equivalent to 3 THz - 0.3 GHz, respectively. As the temperature increases, the strength and extent of the hydrogen bonding both decrease. This (1) lowers both the static and optical dielectric permittivities, (2) lessens the difficulty for the movement dipole and so allows the water molecule to oscillate at higher frequencies, and (3) reduces the drag to the rotation of the water molecules, so reducing the friction and hence the dielectric loss. Note that ε∞ (the dielectric permittivity at short wavelengths) does not change significantly with temperature. Most of the dielectric loss is within the microwave range of electromagnetic radiation (≈ 1 - ≈ 300 GHz, with wavenumber 0.033 cm−1 - 10 cm−1, and wavelength 0.3 m - 1.0 mm, respectively). The frequency for maximum dielectric loss (about 20 GHz) lies higher than the 2.45 GHz (wavenumber 0.0817 cm−1, wavelength 12.24 cm) produced by most microwave ovens. This is so that the radiation is not wholly absorbed by the first layer of water it encounters and may penetrate further into the foodstuff, heating it more evenly; unabsorbed radiation passing through is mainly reflected back, due to the design of the microwave oven, and absorbed on later passes. The rationale for the ~20 GHz peak has been investigated using ab initio molecular dynamics [4336].
Dielectric behavior of water and ice, from [2171]
![Dielectric behavior of water and ice [2171]](images/dielectric_ice.gif "Dielectric behavior of water and ice [2171]")
Water and ice Ih show similar dielectric behavior at the melting point but separated by about 106 Hz, see left [2171]. d At higher frequencies (in the infrared regime), the behaviors are more complex but similar with respect to frequency for both ice and water [3571].
Cole-Cole plots for liquid water and ice

The above data can also be plotted using a Cole-Cole plot, as shown right, of the dielectric permittivity (the real part of the dielectric permittivity) versus the dielectric loss (the imaginary part of the dielectric permittivity). The red circular arcs show the effects of temperature varied by 20 °C amounts from O °C to 100 °C, whereas the thin blue lines show the variations with the temperatures at fixed wavelengths (1.3 - 201 GHz). Also shown for comparison is the plot (blue dashed lines) for pure bulk ice [1230] (note the ~106 ˣ
lower frequencies). ![]()
Shows dielectric and dielectric loss changing with temperature

Note that the shifts in the dielectric properties with temperature give rise to maxima in the temperature behavior at a constant frequency.
Plotted opposite are equations derived for pure water over the range for -20 °C ≈ +40 °C [683], extrapolated (dashed lines) to indicate trends. The equations that generate these curves involve 15 optimized parameters. Further data has been published [1185].
The temperature effect on the dielectric relaxation time is shown on another page.
The dielectric loss factor (Lf) increases to a maximum at the critical frequency.
![]()
![]()
Pressure has a considerable effect on the dielectric behavior of water. The effect of increased pressure on the dielectric and dielectric loss is to shift the curves to lower frequencies, such that the peak in the dielectric loss shifts to about 4 kHz at about -20 °C and 200 MPa [2072].
[Back to Top ![]() ]
]
Dissolved salt depresses the relative permittivity (dielectric constant) dependent on its concentration (C ) and the average hydration number of the individual ions (HN)
![]()
Dielectric reducing but dielectric loss increasing with temperature
at the microwave oven frequency, 2.45 GHz

Figure 2. Dielectric
and dielectric loss of a dilute salt solution between
0 °C and 100 °C (dashed lines; the solid lines
show the pure water curves as Figure
1 above), the arrows showing the effect of increasing
temperature. Data is indicative only; exact data is plotted below. The salt decreases
the natural structuring of the water so reducing the
static dielectric permittivity in a similar manner
to increased temperature. At the lower frequencies,
the ions can respond and move with the changing
potential, producing frictional heat and increasing
the loss factor (Lf). Thus whereas
water becomes a poorer microwave absorber with rising
temperature, a lossy salty food such as salt beef
becomes a better microwave absorber with increasing temperature.
The rate that the temperature of such lossy salty
food increases on microwaving increases as it is proportional
to this increasing loss factor and inversely proportional
to the density times specific heat (which changes less
with temperature); that is, the hotter it gets,
the quicker it gets hotter. ![]()
Dielectric and dielectric loss changing with temperature for a 1% w/w salt solution

Plotted opposite are equations derived at ten parts per thousand w/w (ppt) salinity for the range for -20 °C ≈ +40 °C [683] extrapolated (dashed lines) to indicate trends. Further data is available [1074].
Dielectric and dielectric loss changing with temperature and salinity
at the microwave oven frequency 2.45 GHz

Plotted opposite are equations derived at 2.45 GHz (typical microwave oven frequency) for different parts per thousand w/w (ppt) salinity for the range for -20 °C ≈ +40 °C [683], extrapolated (dashed lines) to indicate trends. The equations that generate these curves involve 46 optimized parameters.
The dielectric loss is increased by a factor that depends on the conductivity (Λ, S cm2 mol−1; S = siemens = mho), concentration, and frequency. It increases with a rise in temperature and decreasing frequency.
![]()
Ensuring that all units are SI,
the 1000 factor in the denominator is important.This 1000 is a conversion
between SI and cm, mol, L units. This emphasizes that careful consideration
must be given to the units used in the microwave literature. Bound water and ice have critical frequencies (λS)
at about 10 MHz (τ about 0.1 μs)
with raised static dielectric permittivities (εS).
At the much higher frequency of microwave ovens, such water has a
low dielectric permittivity (for example, ice-1h, ε∞ = 3.1; compare ice-1h, εS = 97.5 [94]; εS water (0 °C) = 87.9), and is almost transparent,
absorbing little energy. This is particularly noticed on thawing,
where the thawed material may get very hot while unthawed material
stays frozen. Therefore for balanced heating, the thermal effects
must be evenly distributed; that is, there should not be pockets
of salty water within a poorly conducting matrix. [Back to Top ![]() ]
]
The electromagnetic penetration is infinite in a perfectly transparent substance and zeroes in a reflective material (for example, metals). At the microwave oven frequency (2.45 GHz, λ = 12.24 cm), most energy is absorbed by water. The attenuation (α) is given by:
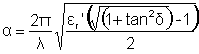
As
if tanδ is « 1
This equation may be approximated where the attenuation is (approximately) directly proportional to the loss factor and inversely proportional to the wavelength times the square root of the relative dielectric constant:
For a plane wave, incident microwaves decrease to 1/e (0.36788; that is, 63% absorbed) in a penetration distance Dp given approximately by:
and so at 2.45 GHz:
Thus, using water at 25 °C, εr´ = 78. Lf =12, tanδ = 0.15, λ = 12.24 cm and Dp = 1.4 cm but the effect is much greater in supercooled water (that may be present in frozen food) where at -17.78 °C (that is, 0 °F), εr´ = 74.4. Lf =40.1, tanδ = 0.54 and Dp = 0.43 cm [1074].
The amount of power (P, in watts m−3) that is absorbed is given by:
P = 2πfε0LfE2
where ε0 = 8.854x10⁻¹² F m−1, f is the frequency (Hz, = ω/2π)
and E is the potential gradient (V m−1). [Back to Top ![]() ]
]
a Hydroxyl groups in sugars and polysaccharides behave similarly, creating a high shear environment. Fats exhibit a lesser effect, but their lower specific heat gives rise to rapid heating. [Back]
b Note the relaxation time is the reciprocal of the frequency in radians per second, whereas the electromagnetic frequency is commonly reported in cycles per second (Hz). [Back]
c The change of static permittivity with temperature (-35 °C < t < 100 °C) may be approximated by the equation
εS(t)=A.e−bt
where A= 87.85306 and b=0.00456992 [588]. [Back]
d Due to the observed similarity of the dielectric spectra of water and ice (as they show the graphics, only shifted along the frequency axis by six decades), the dielectric spectra have been explained using the assumption of a random-walk diffusion of protons without considering the H2O dipole orientations. This is shown to be sufficient to describe both the experimental dielectric spectra of water and ice, as well as their transformation at the freezing-melting point of 0 °C [2171]. [Back]
Home | Site Index | Theory and definitions | Complex dielectric permittivity | Microwaves and health | Water molecule | Water spectra | Notes | LSBU | Top
This page was established in 2001 and last updated by Martin Chaplin on 9 October, 2021
